


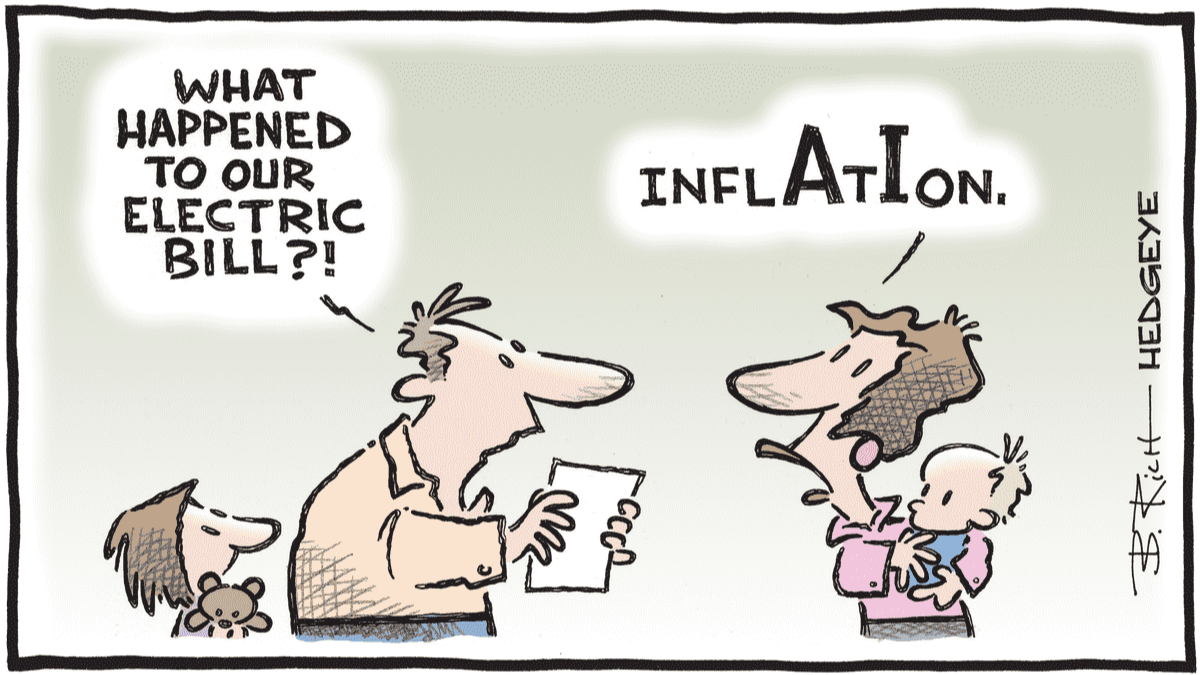
The second quarter of 2026 was a good reminder that markets do not wait for the world to feel calm before moving higher. After a difficult first quarter dominated by the Iran conflict, surging oil prices, and renewed inflation concerns, stocks recovered sharply in Q2. The S&P 500 gained 14.9% for the quarter, the Nasdaq rose 21.4%, and the Dow climbed about 13%. The S&P 500 closed the quarter at 7,499.36, the Dow finished at 52,319.20, and the Nasdaq closed at 26,213.72. For the year, the S&P 500 is now up about 9.6%, the Dow is up 8.9%, the Nasdaq is up 12.8%, and the Russell 2000 is up 21.9%.
That may sound surprising given the headlines. The quarter included war in the Middle East, elevated oil prices, renewed inflation pressure, a change of leadership at the Federal Reserve ushering in a more cautious Federal Reserve, continued tariff uncertainty, questions around consumer confidence, and ongoing debate over whether AI-related stocks have moved too far too fast. Yet markets moved higher.
The reason is not that investors ignore the risks. It is that earnings, AI-related investment, and economic resilience continued to provide enough support for investors to look beyond the immediate headlines. Capital Group summarized this point well in its midyear outlook, noting that many companies are still doing well despite a challenging geopolitical backdrop, with revenue rising, profitability improving, and buybacks remaining strong.
That does not mean everything beneath the surface is equally strong. In fact, one of the most important themes of the quarter is that the market looked strong at the index level, while the story below was more divided.
Market Breadth: What the Index Does Not Always Show
The S&P 500 is often used as shorthand for “the market.” That is convenient, but it can also be misleading. The S&P 500 is a market-cap weighted index. Larger companies carry more influence than smaller companies. If one of the largest companies moves significantly, it can move the index. If one of the smallest companies in the index makes the same percentage move, it may barely register.
The S&P 500 is like a grocery bill where a few expensive items make up most of the total. You may have 500 items in the cart, but if the steaks, seafood, and wine change price, they move the final bill much more than a pack of gum.
That matters today because a rising S&P 500 does not necessarily mean most stocks are rising at the same pace. This is where market breadth becomes important: it tells us whether a rally is being supported by many stocks or carried by a smaller group of leaders.
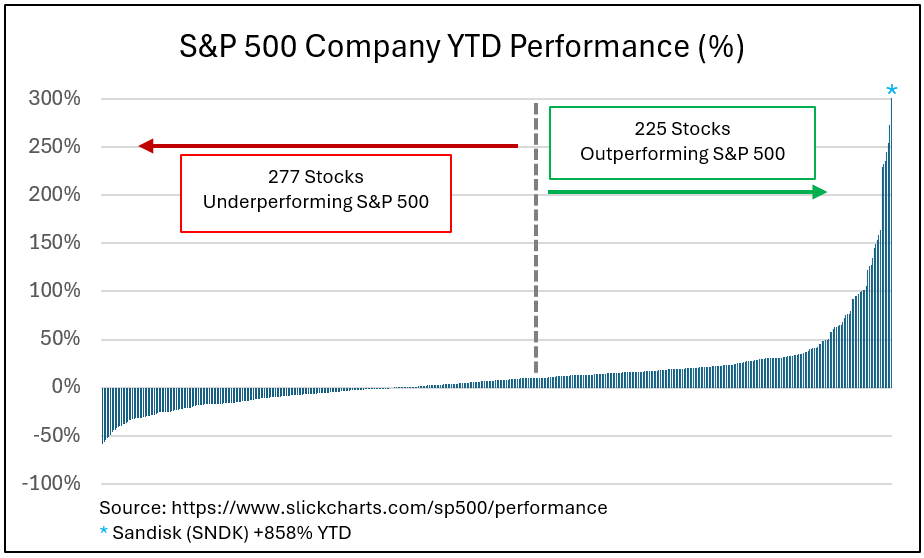
This is where market breadth becomes important. Breadth measures how many stocks are participating in a market move. A broad rally is one where many stocks, sectors, and styles are moving higher together. A narrow rally is one where a smaller group of leaders is doing most of the heavy lifting.
Neither condition automatically means a market must rise or fall. Narrow markets can continue higher for longer than expected. Broad markets can still experience pullbacks. But breadth helps us understand the quality of the rally.
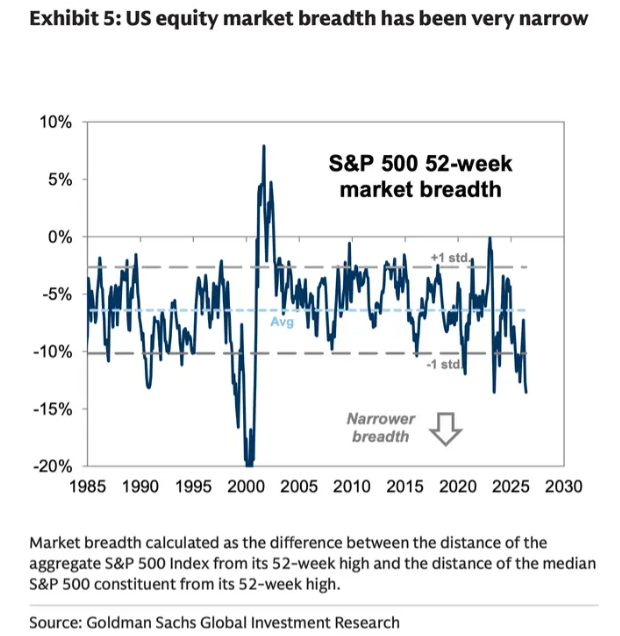
That is a useful reminder that market strength is not always clean or uniform. We had a strong quarter, but it was not simply a “rising tide lifts all boats” environment. The chart below puts today’s narrowness into historical context. Going back to 1985, only the 2000 period showed a wider gap.
Why Index Concentration Matters
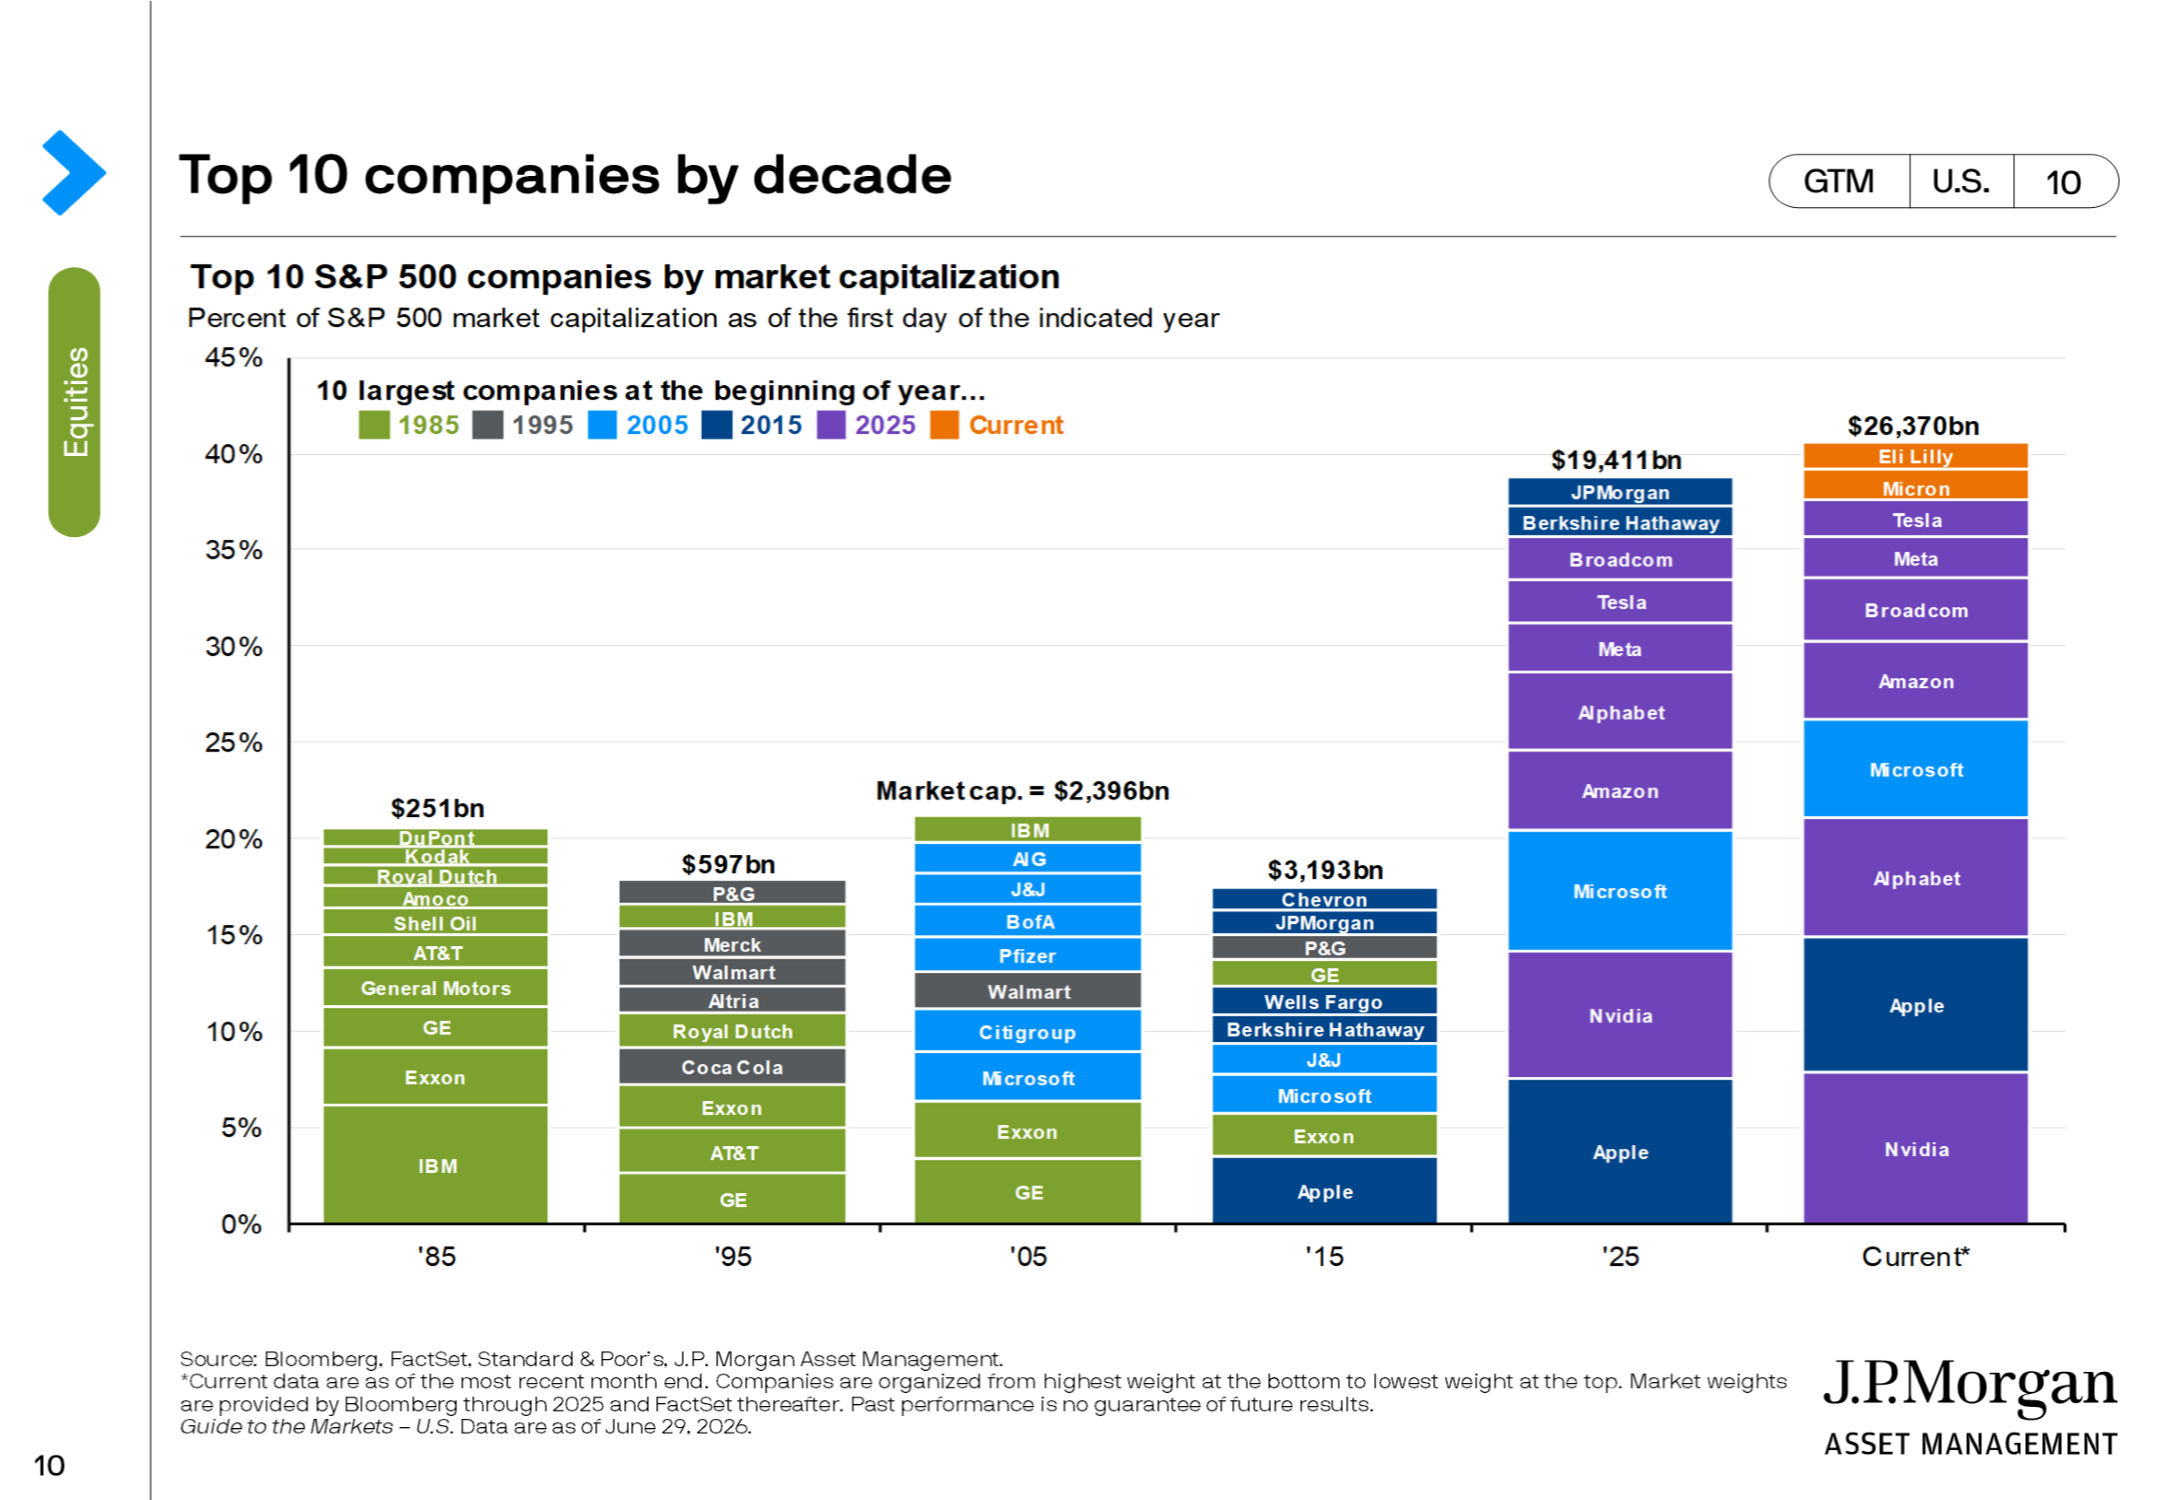
The second piece of the market breadth story is concentration. According to S&P Dow Jones Indices, the top 10 constituents of the S&P 500 recently represented 39.3% of the index (as of 6/30/2026). Slickcharts’ current component list shows Nvidia, Apple, Microsoft, Amazon, Alphabet, Broadcom, Tesla, Meta, and Micron among the largest weights in the index.
That is not necessarily a flaw. Many of these companies are large because they have delivered strong earnings, dominant market positions, and meaningful exposure to major growth themes like AI, cloud computing, semiconductors, digital advertising, e-commerce, and automation. But it does create a practical issue for investors. Owning the S&P 500 is not the same thing as owning 500 equally weighted companies. The top holdings matter much more than the bottom holdings. That concentration can help when the largest companies are rising. It can hurt when they struggle.
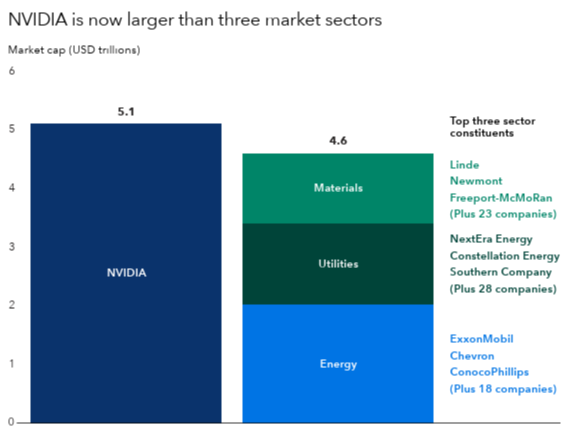
Sources: Capital Group, FactSet, RIMES, S&P Global. As of May 31, 2026. Companies shown are the three largest in their respective sectors within the S&P 500 Index. Caterpillar is the S&P 500 Index industrials sector’s largest company by market capitalization.
*See included graphic at end of this post: “Top 10 companies by decade”, JP Morgan Asset Management.
Capital Group’s midyear outlook put it bluntly: index investors may be exposed to more concentration risk than they realize. Their report noted that U.S. and emerging market indexes have grown increasingly top-heavy, and that the strongest companies and largest companies are increasingly tied to one major fundamental driver: artificial intelligence.
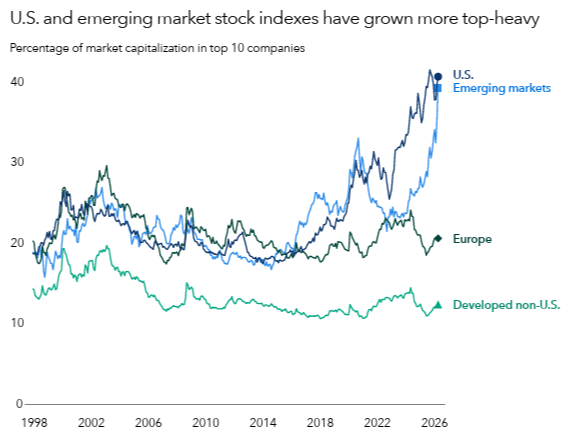
Sources: Capital Group, FactSet, MSCI, S&P Global. Figures represent the index concentration of the top 10 companies by market capitalization across the S&P 500 Index (U.S.), the MSCI Europe Index (Europe), the MSCI World ex USA Index (Developed non-U.S.) and the MSCI EM Index (Emerging markets). Data shown is monthly, from January 30, 1998, through May 31, 2026.
The newer concern is not simply that investors are excited about AI. Many investors may be using similar AI tools, data sets, and models to reach similar conclusions at the same time. A recent Bloomberg/Yahoo Finance story framed this as a “crowded trading” risk: hedge funds, wealth managers, and other investors are increasingly using AI in the search for an edge, but researchers are asking what happens when those models identify the same opportunities, react to the same headlines, and crowd into the same stocks. That does not mean AI is a fad or that the opportunity is not real. It does mean the market may become more vulnerable to sudden reversals if too many investors are standing on the same side of the boat. AI may be a powerful long-term growth story, but when enthusiasm, positioning, and index concentration all point in the same direction, discipline matters even more.
Artificial intelligence remained one of the dominant market stories in the second quarter. The opportunity is real, but so is the risk that too much enthusiasm becomes concentrated in the same stocks at the same time.
AI: More Than a Theme, but Still a Risk
Artificial intelligence remained one of the dominant market stories in the second quarter. The investment spending is enormous. Capital Group wrote that AI-related investment may be large enough to offset weakness in other parts of the economy, especially in the U.S. Their economists described AI as one of the central forces helping the economy hold up despite the Iran war, higher oil prices, and trade disputes.
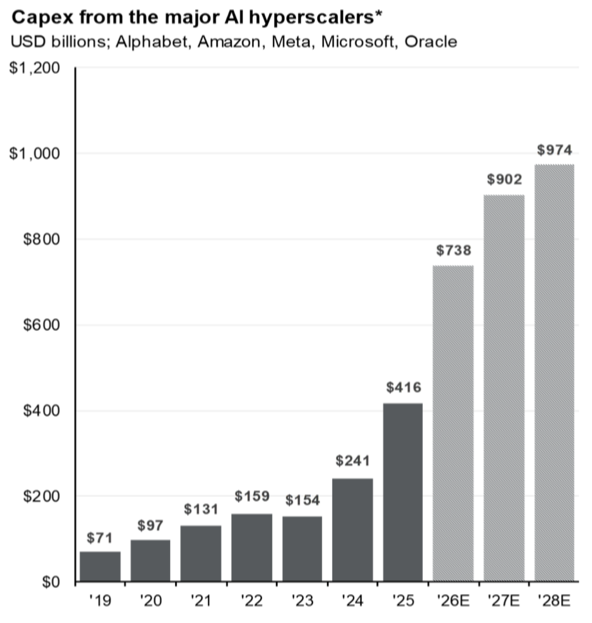
Source: Bloomberg, J.P. Morgan Asset Management.
This is bigger than a handful of software companies. AI spending flows into semiconductors, data centers, power infrastructure, cooling systems, construction, industrial equipment, cloud capacity, and electrical grid demand. That is one reason the market has been able to rally even while many traditional economic indicators look mixed.
Alger’s “Greatest Growth Story” piece is also useful here. It highlights that U.S. real GDP per capita has risen more than 60-fold since the country’s founding, driven by successive waves of innovation, from canals and railroads to electricity, automobiles, air conditioning, personal computers, the internet, and now generative AI.
That is the optimistic side of the story. Innovation has been one of the great long-term engines of wealth creation.
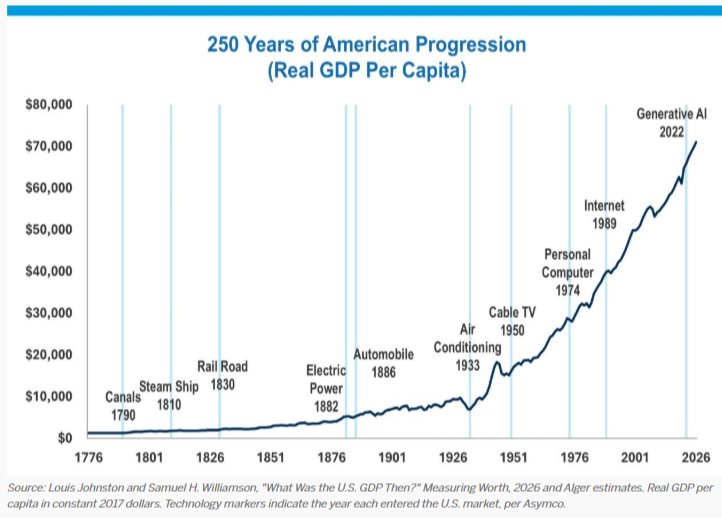
The cautionary side is that every major innovation cycle also creates winners, losers, excess enthusiasm, and eventually disappointment for companies that cannot turn promise into profits. The market seems increasingly focused on that distinction. It is no longer enough for a company to say “AI” on an earnings call. Investors are starting to ask whether AI spending is producing real revenue, real margins, and real cash flow.
That is healthy. It does not eliminate volatility, but it brings the conversation back to fundamentals.
The Fed: Inflation Is Still the Hinge
The Federal Reserve remained a central part of the market conversation during the quarter. At its June 17 meeting, the Fed held the federal funds rate steady at 3.50% to 3.75%. In its statement, the Fed said economic activity was expanding at a solid pace despite elevated uncertainty tied in part to the Middle East conflict. The Fed also noted that productivity growth and capital investment remain strong, while inflation remains elevated relative to its 2% goal.
That is the Fed’s dilemma in plain English. The economy is not weak enough to force rate cuts, but inflation is too high to give the Fed much room for easing rates.
The May PCE report reinforced that tension. PCE, which is the Fed’s preferred inflation measure, rose 4.1% from a year earlier. Core PCE, which excludes food and energy, rose 3.4%. Current-dollar consumer spending increased 0.7% in May, while real consumer spending increased 0.3%.
This is not the inflation environment of 2022, but it is not “mission accomplished” either. Inflation has improved from the worst levels of the last cycle, but the final stretch back to 2% has proven difficult. Energy prices, tariffs, services inflation, insurance costs, and supply shocks have all complicated the path. The Fed can slow demand, but it cannot produce more oil, reopen shipping lanes, or directly solve tariff-driven price increases.
That is why the next several inflation and labor reports matter. As the third quarter begins, markets are watching Fed Chair Kevin Warsh closely for clues about the path of policy. Reuters reported that global markets paused after the strong Q2 rally as investors turned their attention to Warsh’s remarks and upcoming U.S. jobs data. Oil was trading near pre-war levels, with Brent at around $72 per barrel, which is a meaningful change from the oil shock that dominated the first quarter. Lower oil helps. But it does not solve everything.
The Labor Market: Cooling, but Not Cracking
The labor market remains one of the most important swing factors for the economy and the Fed. The latest official employment report showed that employers added 172,000 jobs in May, while the unemployment rate held steady at 4.3%. The unemployment rate has remained in a narrow range of 4.3% to 4.5% since July 2025. That is not a weak labor market. But it is also not the extremely tight labor market we saw a few years ago.
This is the type of balance the Fed has been trying to achieve: slower job growth, less wage pressure, but no sharp rise in unemployment. The challenge is that the margin for error has narrowed. If employment weakens meaningfully, consumer spending could slow. If the labor market remains firm and inflation remains elevated, the Fed may feel pressure to remain restrictive or even raise rates again.
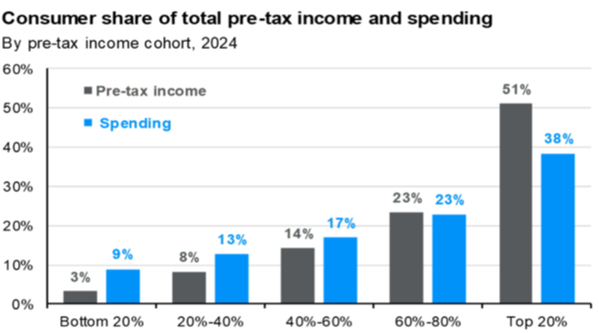
Moody’s Analytics Chief Economist Mark Zandi framed this pressure as evidence that the K-shaped economy remains firmly intact. According to Zandi, the top 20% of earners, households making more than roughly $175,000 per year, now account for nearly 60% of consumer spending. That helps explain why the economy can look resilient in the headline data while still feeling strained for many families. Higher-income households are benefiting from stronger incomes, stock portfolios, home equity, and healthier balance sheets, while lower- and middle-income consumers continue to absorb higher costs for rent, groceries, insurance, utilities, and debt payments.
The K-Shaped Economy: Confidence Says One Thing, Spending Says Another
There is a tale of two stories in the consumer data. On one hand, consumer confidence remains weak. The Conference Board’s Consumer Confidence Index increased slightly in June to 91.2, up from 90.6 in May, but that is still a subdued reading. The report also noted that 22.5% of consumers said jobs were “hard to get,” the highest reading since January 2021. On the other hand, consumer spending has remained resilient. BEA data showed current-dollar personal consumption expenditures rose 0.7% in May, with spending increasing on both services and goods.
So which is it? Are consumers struggling or still spending? The answer is yes.
This is where the K-shaped economy becomes a helpful framework. Moody’s Chief Economist, Mark Zandi, recently noted that the top 20% of earners, households making more than roughly $175,000 per year, now account for nearly 60% of consumer spending. That helps explain why the economy can look resilient in the headline data while still feeling strained for many families. Higher-income households may be supported by stronger incomes, investment portfolios, home equity, and healthier balance sheets. Lower- and middle-income households have less room for error, especially when more of their income is going toward rent, groceries, utilities, insurance, gasoline, and debt payments.
The stock market and the household economy are related, but they do not always move on the same timeline. Households are living with today’s reality. Wall Street is looking ahead and pricing in future earnings, profit margins, AI-related investment, and productivity gains. That helps explain why major indexes can sit near record highs while many families still feel like the economy is getting harder, not easier. For investors, the risk is behavioral: when Main Street feels strained but Wall Street keeps moving higher, it becomes tempting to sit in cash and wait for the “all-clear” signal. History tells us that signal rarely arrives neatly.
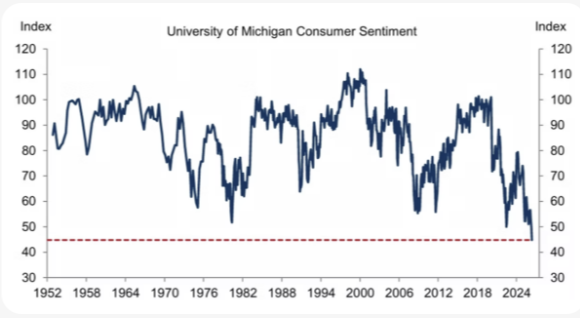
This is where the K-shaped economy becomes a helpful framework. Higher-income households, especially those with investment portfolios, home equity, and stable employment, have generally been better positioned to absorb higher prices. They may also benefit directly from rising asset values.
Lower- and middle-income households have less room for error. Higher food prices, insurance premiums, rent, gas prices, credit card rates, and service costs can force trade-offs much faster.
That is why consumer confidence can look weak while consumer spending remains strong. The top half of the economy may continue spending, investing, traveling, and supporting earnings. The lower half may feel much more pressure from the same inflation data.
Source: J.P. Morgan Asset Management; Federal Reserve
For markets, this matters because consumer spending remains a major driver of the U.S. economy. If spending continues to hold up, earnings can remain resilient. If price pressure and job uncertainty eventually weigh on spending, investors may need to reassess growth expectations.
Oil, Iran, and the Market’s Short Memory
The first quarter was dominated by oil. The second quarter showed how quickly markets can shift when the worst-case scenario begins to look less likely.
In June, the U.S. and Iran signed an interim agreement aimed at reopening the Strait of Hormuz and moving toward a final deal. Oil prices moved lower as de-escalation hopes improved. That helped reduce inflation fears and supported risk assets.
State Street’s geopolitical conflict research provides a useful context. They found that past market selloffs tied to geopolitical oil supply shocks have often been short-lived when those shocks did not become prolonged physical supply disruptions. Their data showed that across seven oil supply shocks since the First Gulf War, equities tend to sell off initially, but were higher one year and two years later.
That does not mean every geopolitical event should be ignored. It means markets tend to care most about whether the event changes the path of earnings, inflation, interest rates, or economic growth. When the risk of a prolonged supply disruption fades, markets often move on faster than the headlines do.
That is frustrating, but it is normal.
Outlook: Resilient, but Not Risk-Free
As we enter the second half of 2026, the outlook is constructive but not simple. On the positive side, corporate earnings remain supportive, AI-related investment continues to drive growth, the labor market is cooling but not breaking, and consumers are still spending. The market has also shown impressive resilience in the face of geopolitical shocks.
On the cautious side, inflation remains above the Fed’s target, the Fed may not be as quick to cut as investors once hoped, valuations remain elevated in parts of the market, and concentration risk is real. The top names in the S&P 500 carry tremendous influence. Market breadth has improved in some areas, but the rally remains uneven.
This is where discipline matters. It is tempting to believe the right move is to predict the next Fed decision, oil move, AI winner, or geopolitical headline. But long-term investment success usually does not come from predicting every short-term turn. It comes from having a strategy that can survive them.
The second quarter rewarded investors who stayed patient through the first quarter’s oil shock and geopolitical uncertainty. That does not mean the next quarter will be easy. It simply reinforces the same lesson we have seen repeatedly: markets are forward-looking, headlines are noisy, and investor behavior often matters more than the market’s next move.
A sound strategy should include diversification, proper allocation, enough liquidity for near-term needs, and a willingness to stay invested through uncomfortable periods. Volatility is not an interruption to investing. It is part of the journey.
The second quarter rewarded investors who stayed patient through the first quarter’s oil shock and geopolitical uncertainty. That does not mean the next quarter will be easy. It simply reinforces the same lesson we have seen repeatedly: markets are forward-looking, headlines are noisy, and investor behavior often matters more than the market’s next move.
Thank you for your continued trust and confidence. I hope you and your family are enjoying the summer, and I look forward to speaking with you soon.
If you have any questions or would like to discuss your personal circumstances, please do not hesitate to reach out to me. Thank you for your continued confidence.
Rob Leiphart, CFP®
203-220-6474
rleiphart@rbcapitalmanagement.com